Protected Enclosure
HYDROS Ports
Controls
WaveEngine
Setup
FAQ
Contact Us
View Example Setups
Products
Coming Soon
Duet
View More
Maven
View More
HYDROS XHO Light
View More
Controls
Start
View More
Blenny
View More
Launch
View More
Minnow
View More
Sole
View More
Control XP8
View More
Control X10
View More
Kraken
View More
All Controllers
View More
Sense Port Accessories
Triple Optical Water Level
View More
Standard Optical Water Level
View More
Skimmer Water Level Sensor
View More
Magnet Temperature
View More
Dual Inline TDS Meter
View More
Point Leak Detector
View More
Rope Leak Kit
View More
Float Switch
View More
Flow
View More
Slim Temperature
View More
Drive Port Accessories
HYDROS iV PRO
View More
DC Micro Pump
View More
Auto-Top-Off Kit
View More
Diaphragm Water Pump
View More
Solenoid Water Valve
View More
Simple Dosing Pump
View More
CO2 Solenoid Valve
View More
WiFi Accessories
WiFi Power Strip
View More
WiFi Fish Feeder
View More
WiFi Smart Plug
View More
Other
HYDROS 2mL-min Dosing Pump
Cables and Adapters
Sense Port Extension Cable
Drive Port Extension Cable
Drive Port Cable
0-10V Quad Cable
Command Bus Cable (DATA Only)
Command Bus Cable (DATA+Power)
HYDROS Command Bus Terminator
HYDROS Kraken Battery Backup Cable
HYDROS Kraken Force Port 24v Adapter Cable
HYDROS Kraken Force Port Power Cable
WaveEngines
WaveEngine
View More
WaveEngine LE
View More
Setup
Web App
Community
Where to Buy
HYDROS Online Manual
HYDROS Control
Input Graphs
Input Graphs
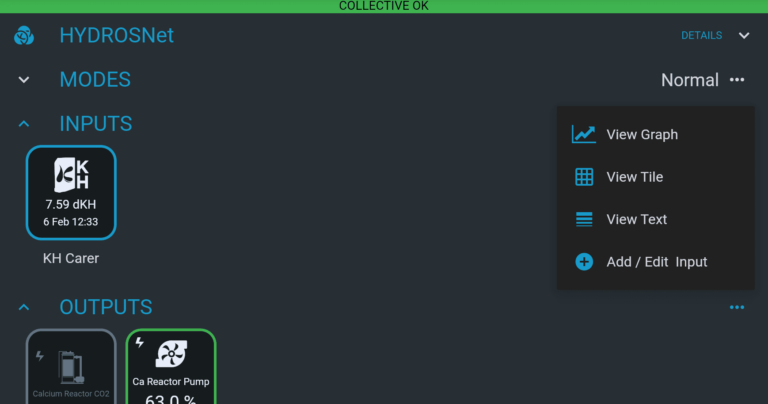
To view HYDROS Input Graphs, do the following:
First, from the STATUS screen, find the “Input” section.
Then, tap the three horizontal dots to the right of the word “INPUTS” and select “View Graph.”
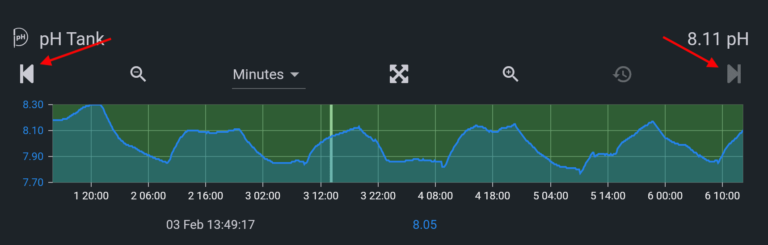
You can do the following with HYDROS graphs:
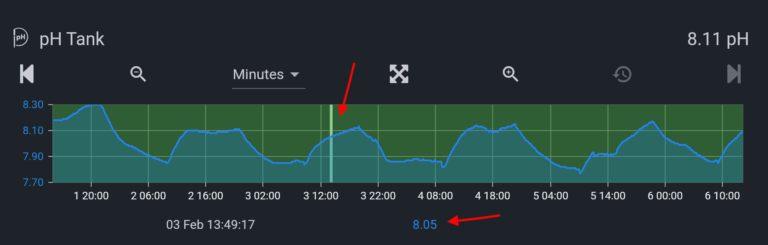
You can tap anywhere on the chart to see a specific value.
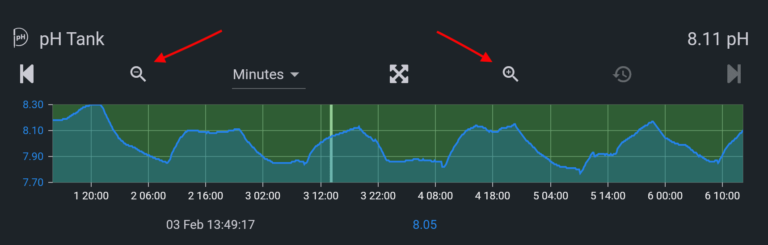
Zoom In/Out by tapping on the magnifying glasses above the graph.
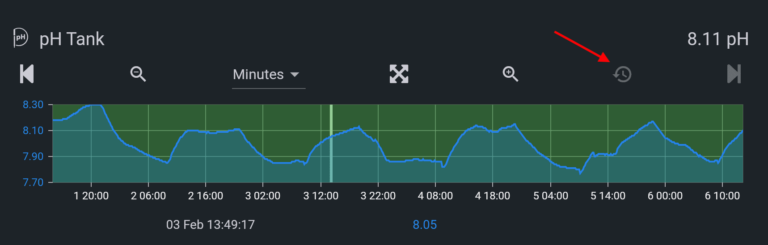
You can reset it to the default view by tapping on the counterclockwise arrow icon above the chart.
Finally, you can move horizontally along the timeline by tapping on the left or right icons above the chart.
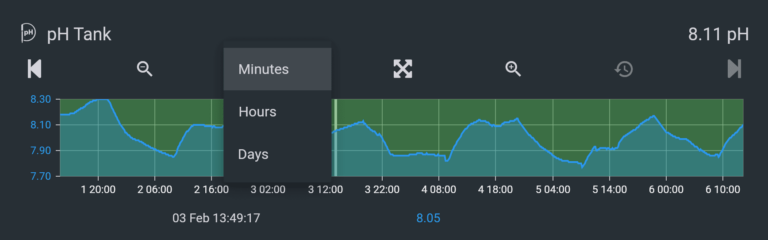
You can change the time interval of the graph:
Minutes: The graph will display seven days of data at 10-minute intervals. You can zoom out to 30 days maximum.
Hours: The graph will display 45 days of data at 2-hour intervals. You can zoom out to 90 days maximum.
Days: The graph will display 60 days of data at 1-day intervals. You can zoom out to 365 days maximum.
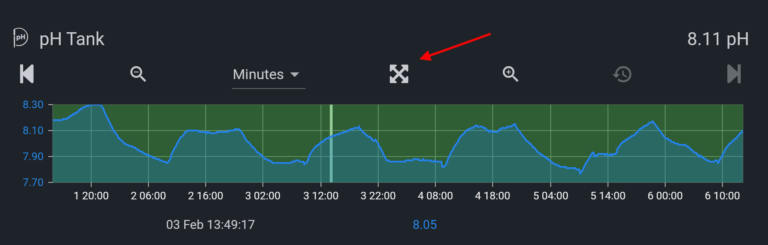
You can view the graph as a full page by clicking on the four-arrow icon above the graph.
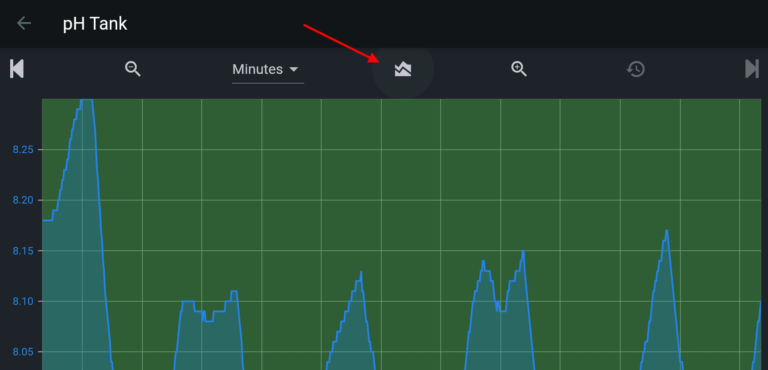
While in the “Full Page” view, you can also overlay one additional input by clicking on the overlay icon to the right of the interval option.
Print This Page
Devices
Setting up the Blenny
Setting up the Kraken
Setting up the Launch
Setting up the Minnow
Setting up the Sole
Setting up the Start
Setting up the WaveEngine
Setting up the WaveEngine LE
Setting up the X10
Setting up the X2
Setting up the X3
Setting up the X3-S
Setting up the X4
Setting up the XD
Setting up the XP8
Setting up the XS
Setup the HYDROS App
Download the HYDROS App
Creating a Cloud Account
Connecting to Your WiFi Network (BT)
Updating to the Latest Firmware
Real Time Notifications
The Rest of the App
Understanding the Status Screen
Understanding the Options Screen
Emergency Mode Access (No Internet nor Mobile Data)
Account Settings
Using Biometrics with HYDROS
Sharing HYDROS Devices/Collective Access
Device Properties
Backup & Restore
Input Graphs
Logging
Understanding the LEDs
Pages
Add/Configure a Page
Pair WiFi Devices
Pair WiFi Strip/Smart Outlet
Pair WiFi Feeder Device
Rename a WiFi Device
Inputs/Sensors
Add 0-10V Input
Add Alkalinity (iV Tester) Input
Add Alkatronic
Add Conductivity/Salinity Probe
Add Diagnostic Input
Add Float Water Level
Add Flow Rate Sensor
Add KH Carer
Add Mastertronic
Add ORP Probe
Add pH Probe
Add Point Leak Detector
Add Rope Leak Detector
Add “Sampled” pH Input
Add “Sampled” Salinity Input
Add Skimmer Water Level Sensor
Add Static Input
Add TDS (Dual) Meter
Add Temperature Sensor
Add Triple Water Level Sensor
Add Water Level Sensor
Outputs
Add Alert Output
Add ATO
Add Automatic Water Changer (AWC)
Add Calcium Reactor
Add Chiller/Fan
Add Combiner Output
Add Constant Output
Add Feeder Output
Add Flow Pump (Direct Drive)
Add Flow Pump (0-10V)
Add Generic Output
Add Heater
Add iV Tester
Add Kalkwasser Reactor
Add Klir Filter
Add Light (0-10V)
Add Light (Fluorescent)
Add Light (LED)
Add Light (Metal Halide Light – MH)
Add Ozone Generator
Add Protein Skimmer
Add Return Pump
Add RODI Filter
Add Simple Doser
Add Smart Doser (X10, Sole, Minnow, Blenny)
Add 3rd Party Devices
Add Focustronic Connection
Add KH Carer Connection
Add a Sicce® Pump
Schedules
Add Dosing Regimen Schedule
Add Flow Pump Schedule
Add Lighting Schedule
Add Test Regimen
Add Water Change Schedule
Manual One-Time Dose
Modes
Create a Mode
Low Power Mode
Multiple Controls (Collective)
HYDROS Collective 101
Creating a New Collective
Adding a Second Device to an Existing Collective
Replacing a Collective Device
Removing a Collective Device
Collective Errors
XP8
Setting up the XP8
XP8 AC Outlet LED Colors
Kraken
Setting up the Kraken
Kraken FAQ
Disable Battery Charger
Connect 12V Battery to the Kraken
Launch
Setting up the Launch
Troubleshooting
What kind of WiFi Network or Router Do I Need?
Bad SD Card
Breathing Yellow (No Internet)
Breathing Red (Lost WiFi)
Configuration Mismatch Warning
Configuration Stale Warning
Firmware Mismatch Warning
Read-Only Mode
Rename a Device
Reset to Factory Default
Understanding the LEDs
Unregister a Device
Update WiFi Credentials