To view HYDROS Input Graphs, do the following:
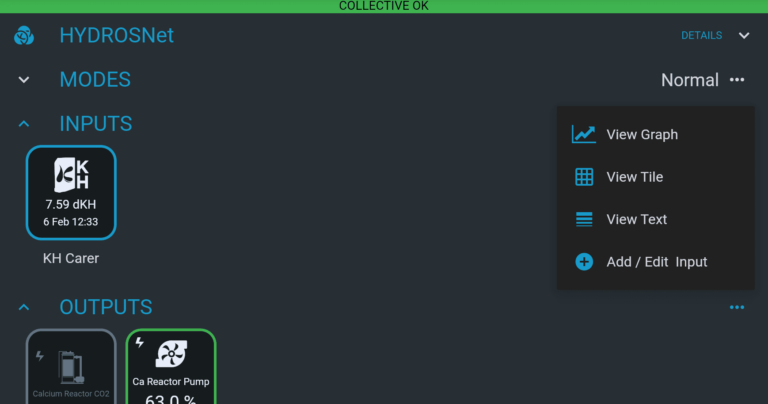
- First, from the STATUS screen, find the “Input” section.
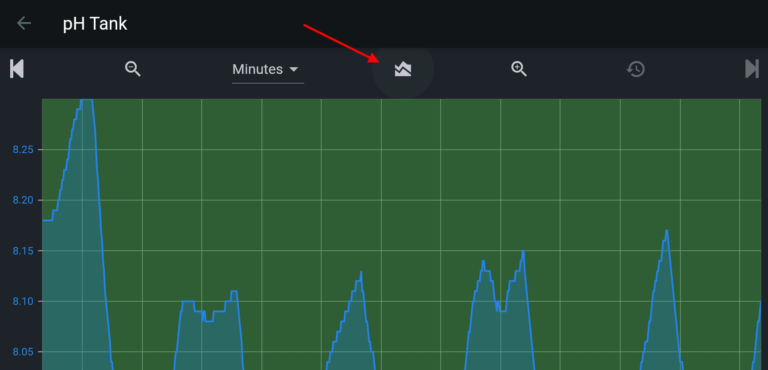
- Then, tap the three horizontal dots to the right of the word “INPUTS” and select “View Graph.”
You can do the following with HYDROS graphs:
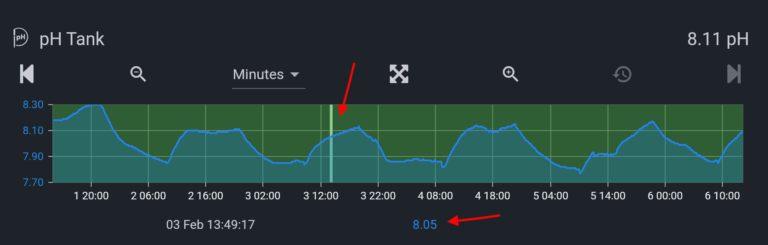
- You can tap anywhere on the chart to see a specific value.
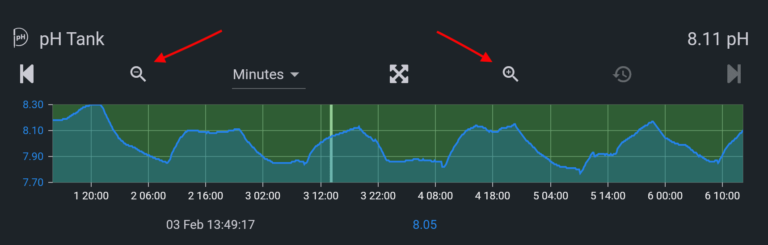
- Zoom In/Out by tapping on the magnifying glasses above the graph.
- You can reset it to the default view by tapping on the counterclockwise arrow icon above the chart.
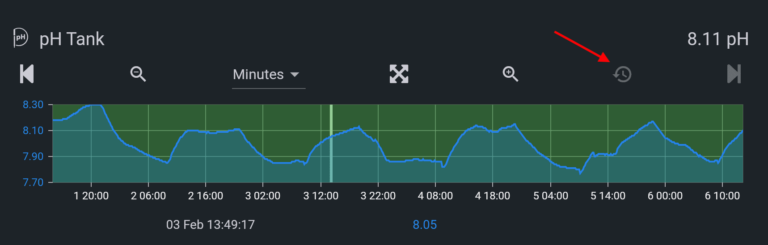
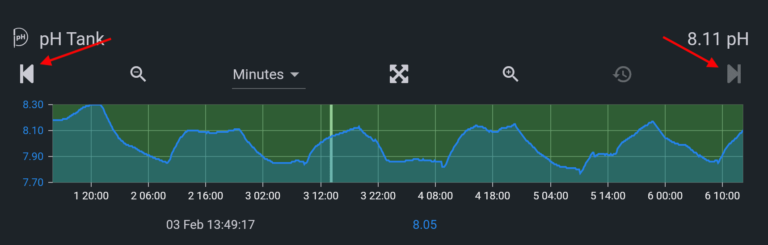
- Finally, you can move horizontally along the timeline by tapping on the left or right icons above the chart.
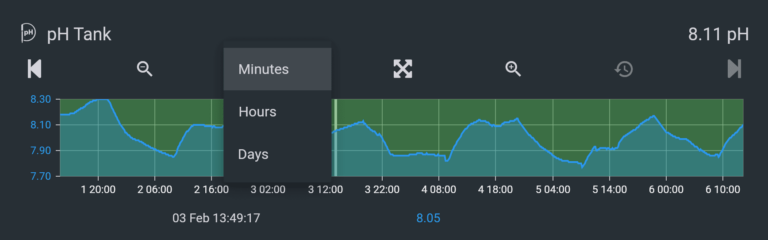
- You can change the time interval of the graph:
- Minutes: The graph will display seven days of data at 10-minute intervals. You can zoom out to 30 days maximum.
- Hours: The graph will display 45 days of data at 2-hour intervals. You can zoom out to 90 days maximum.
- Days: The graph will display 60 days of data at 1-day intervals. You can zoom out to 365 days maximum.
- You can view the graph as a full page by clicking on the four-arrow icon above the graph.
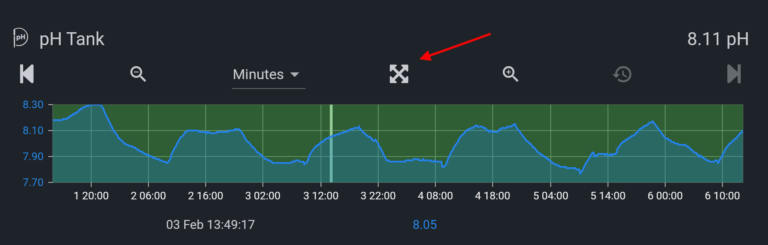
- While in the “Full Page” view, you can also overlay one additional input by clicking on the overlay icon to the right of the interval option.